Monitoring and Observability
Once deployed you want to know as much as possible about how your stack is performing - whether the required metrics are being achieved and whether anything has gone wrong.
Metrics
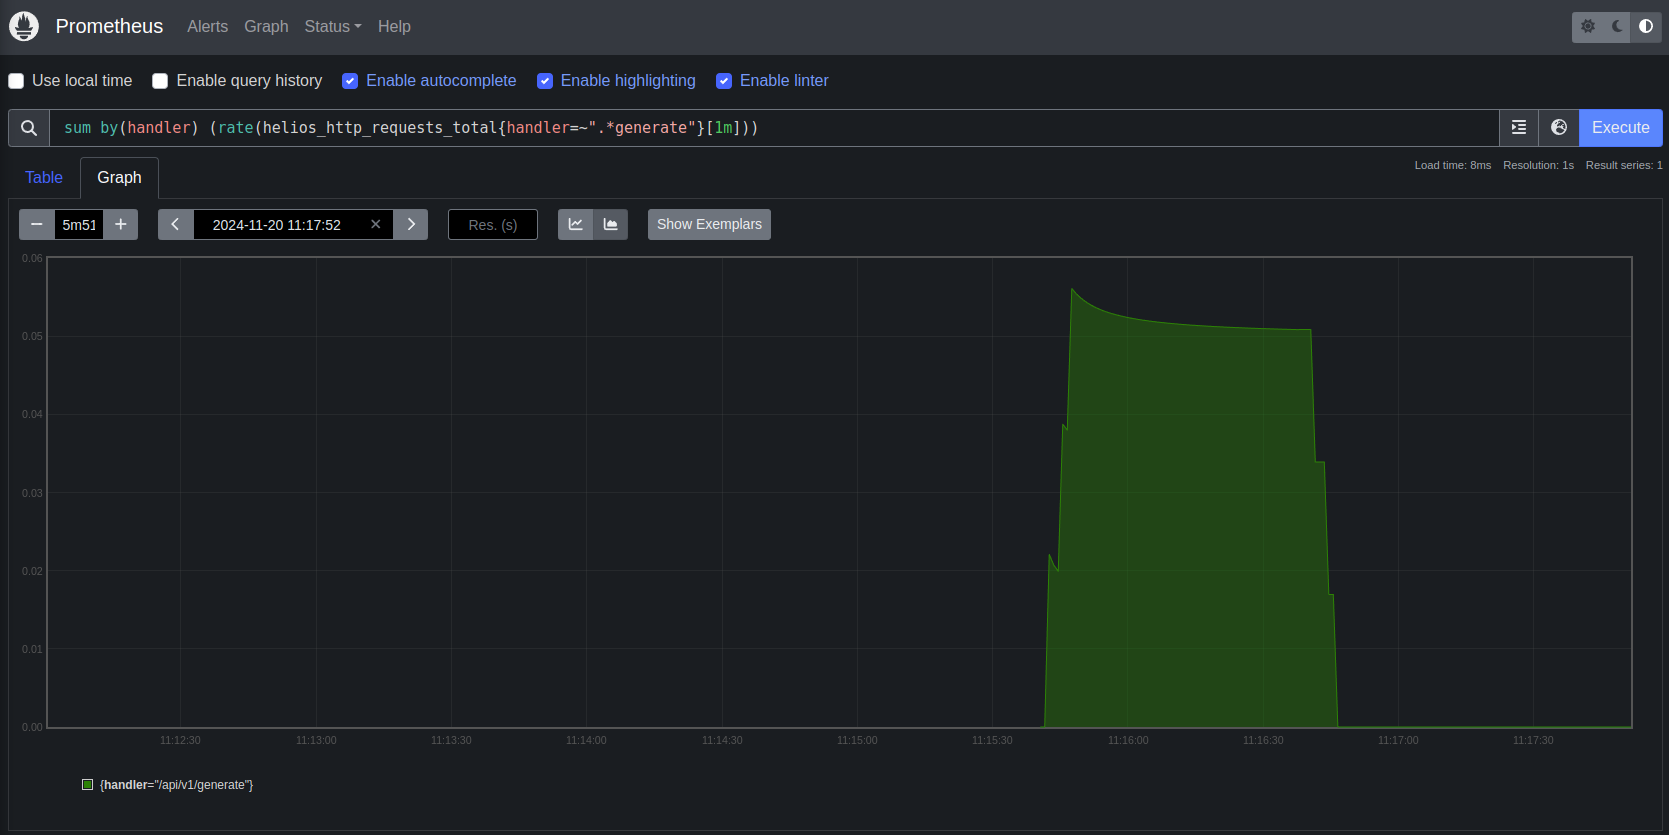
We use Prometheus to collect metrics from all the components of the stack. This allows us to monitor the health of the stack and set alerts based on these metrics. We also publish custom metrics to the Kubernetes API which can be used for scaling decisions. You can query these metrics with Prometheus' query language (PromQL) to get insights into the performance of the stack. We can expose this data to you so you can build custom monitoring systems, or you can use our pre-built dashboards and alerts.

Visualisation
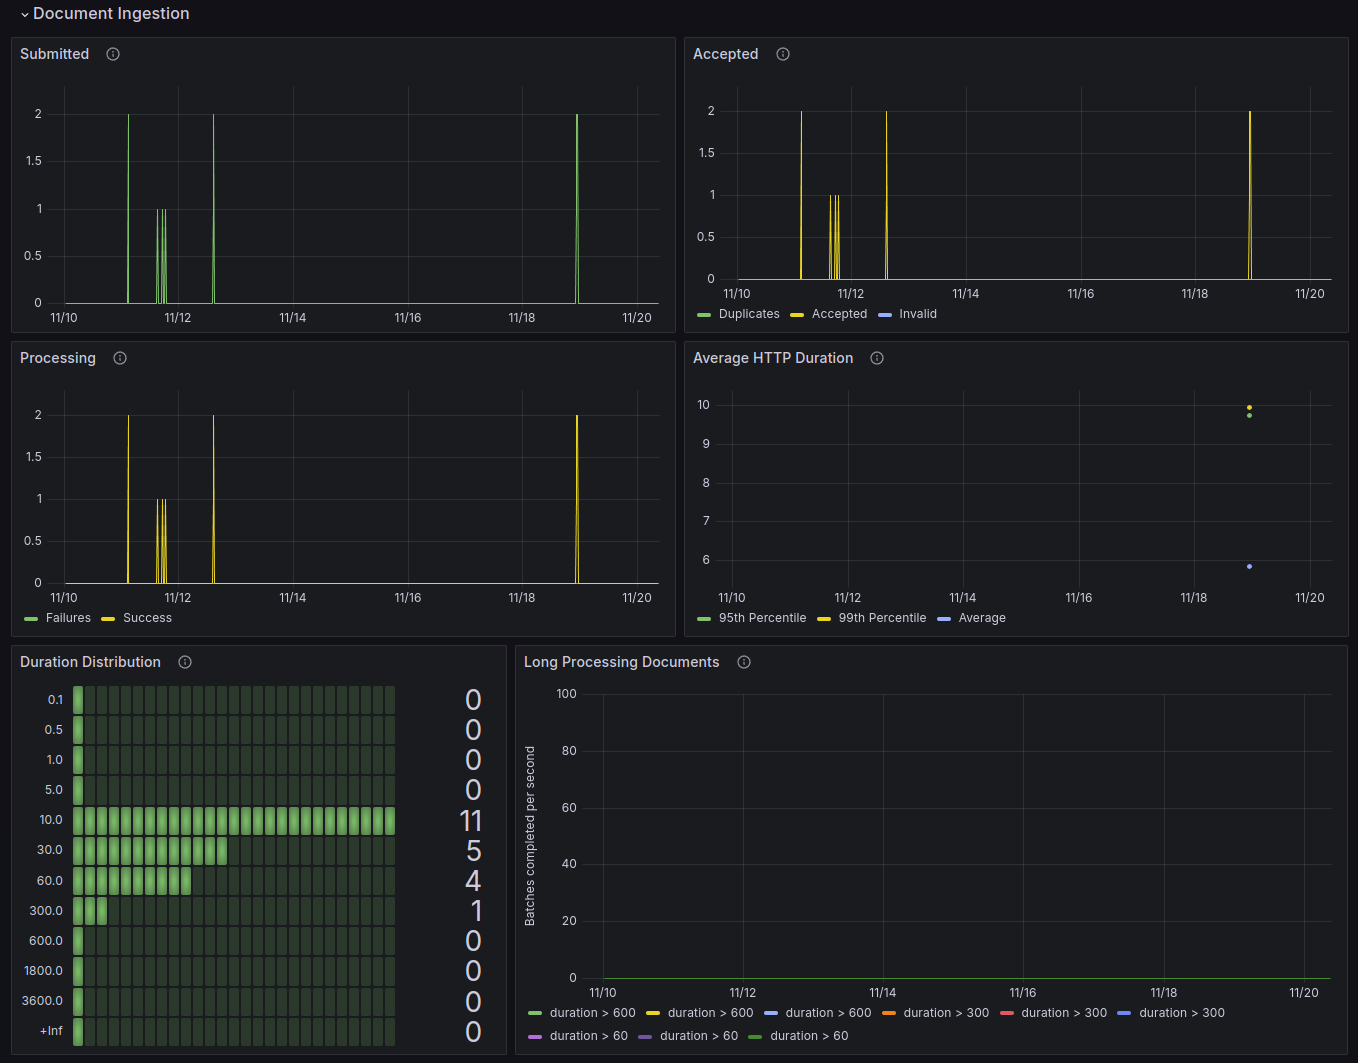
Once we have these metrics centralised we built custom dashboards in Grafana to visualise your Takeoff Stack. This allows us to monitor the stack in real-time and diagnose issues quickly. We also provide access to logging through Grafana, so you have a single place to visualise your cluster.

Alerting
We know how crucial it is to know about problems in your infrastructure before your users do. Therefore, we have custom alerting that helps you stay on top of issues. We use Grafana to set up alerts based on the metrics we collect with Prometheus and can send these alerts to your preferred notification system.

Logging
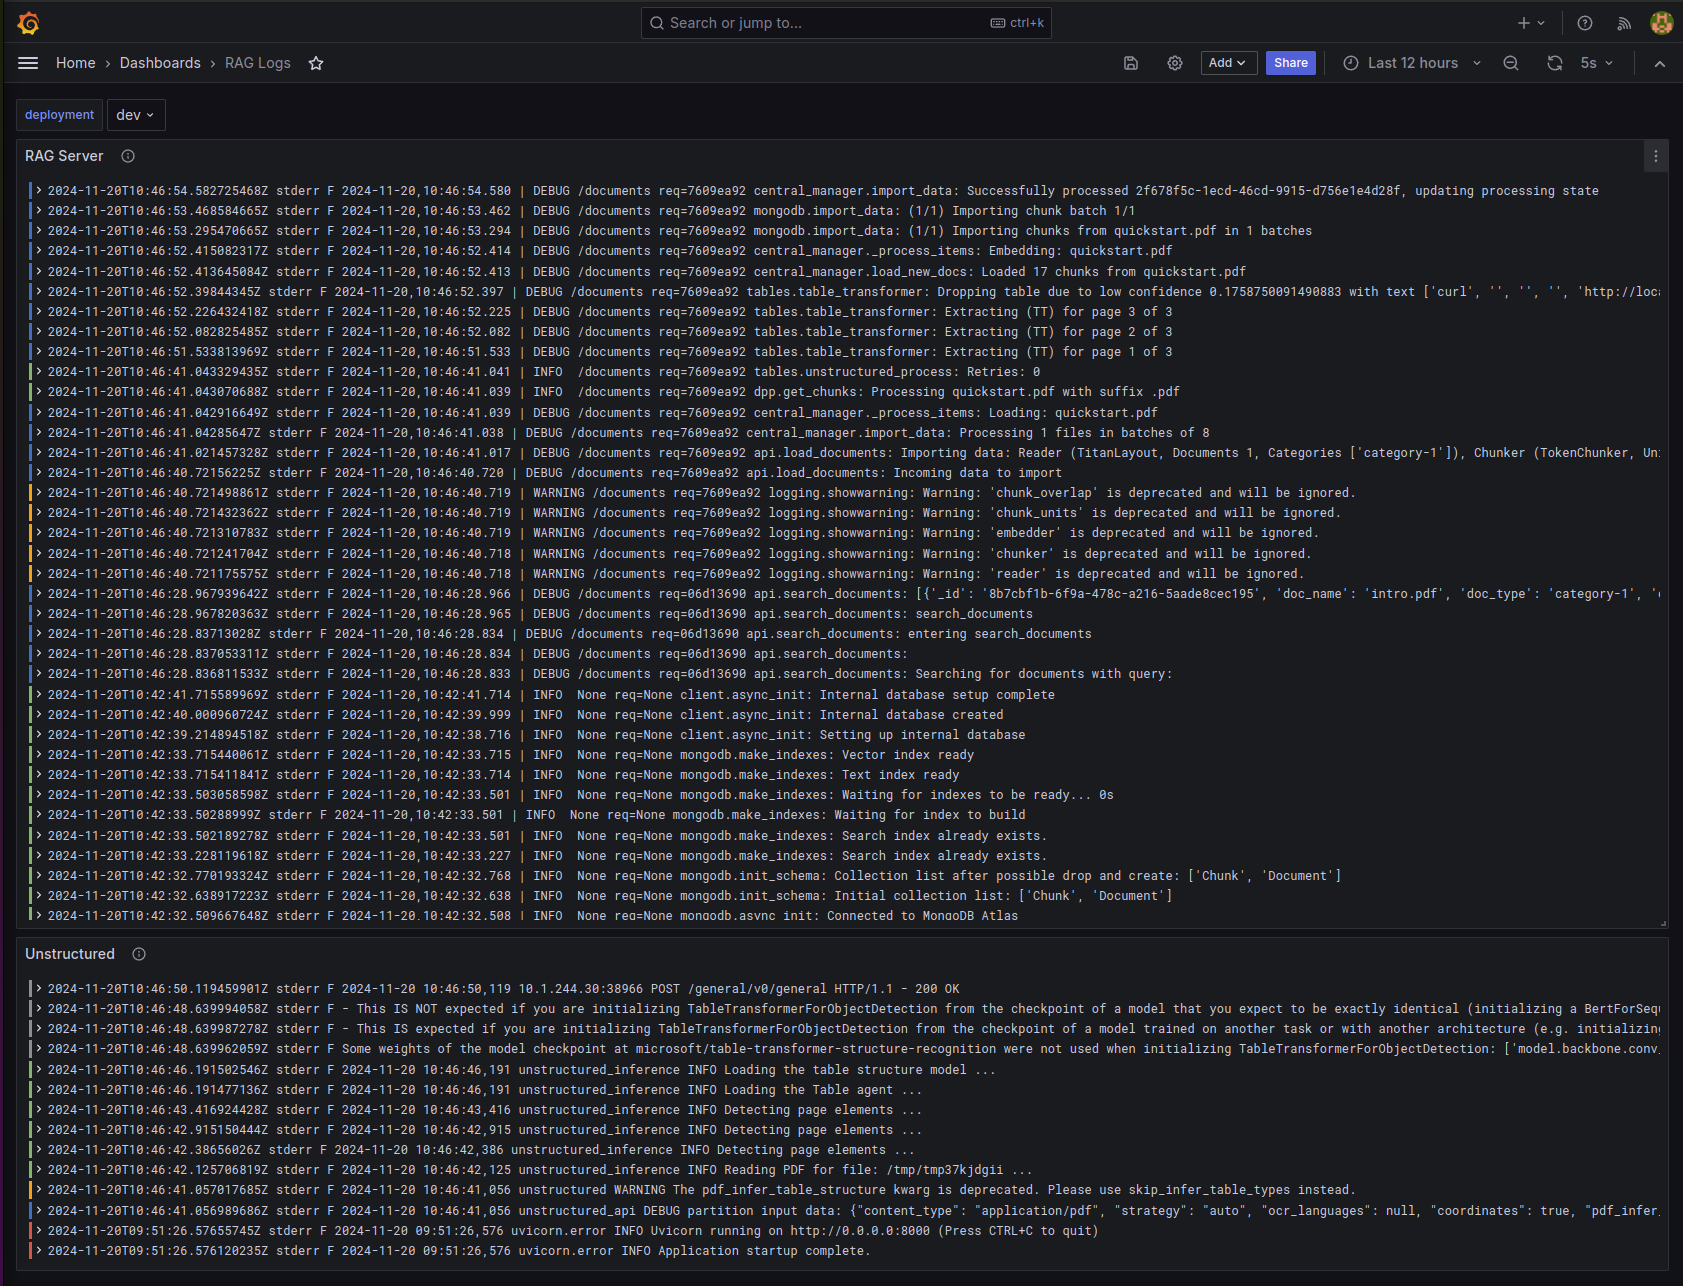
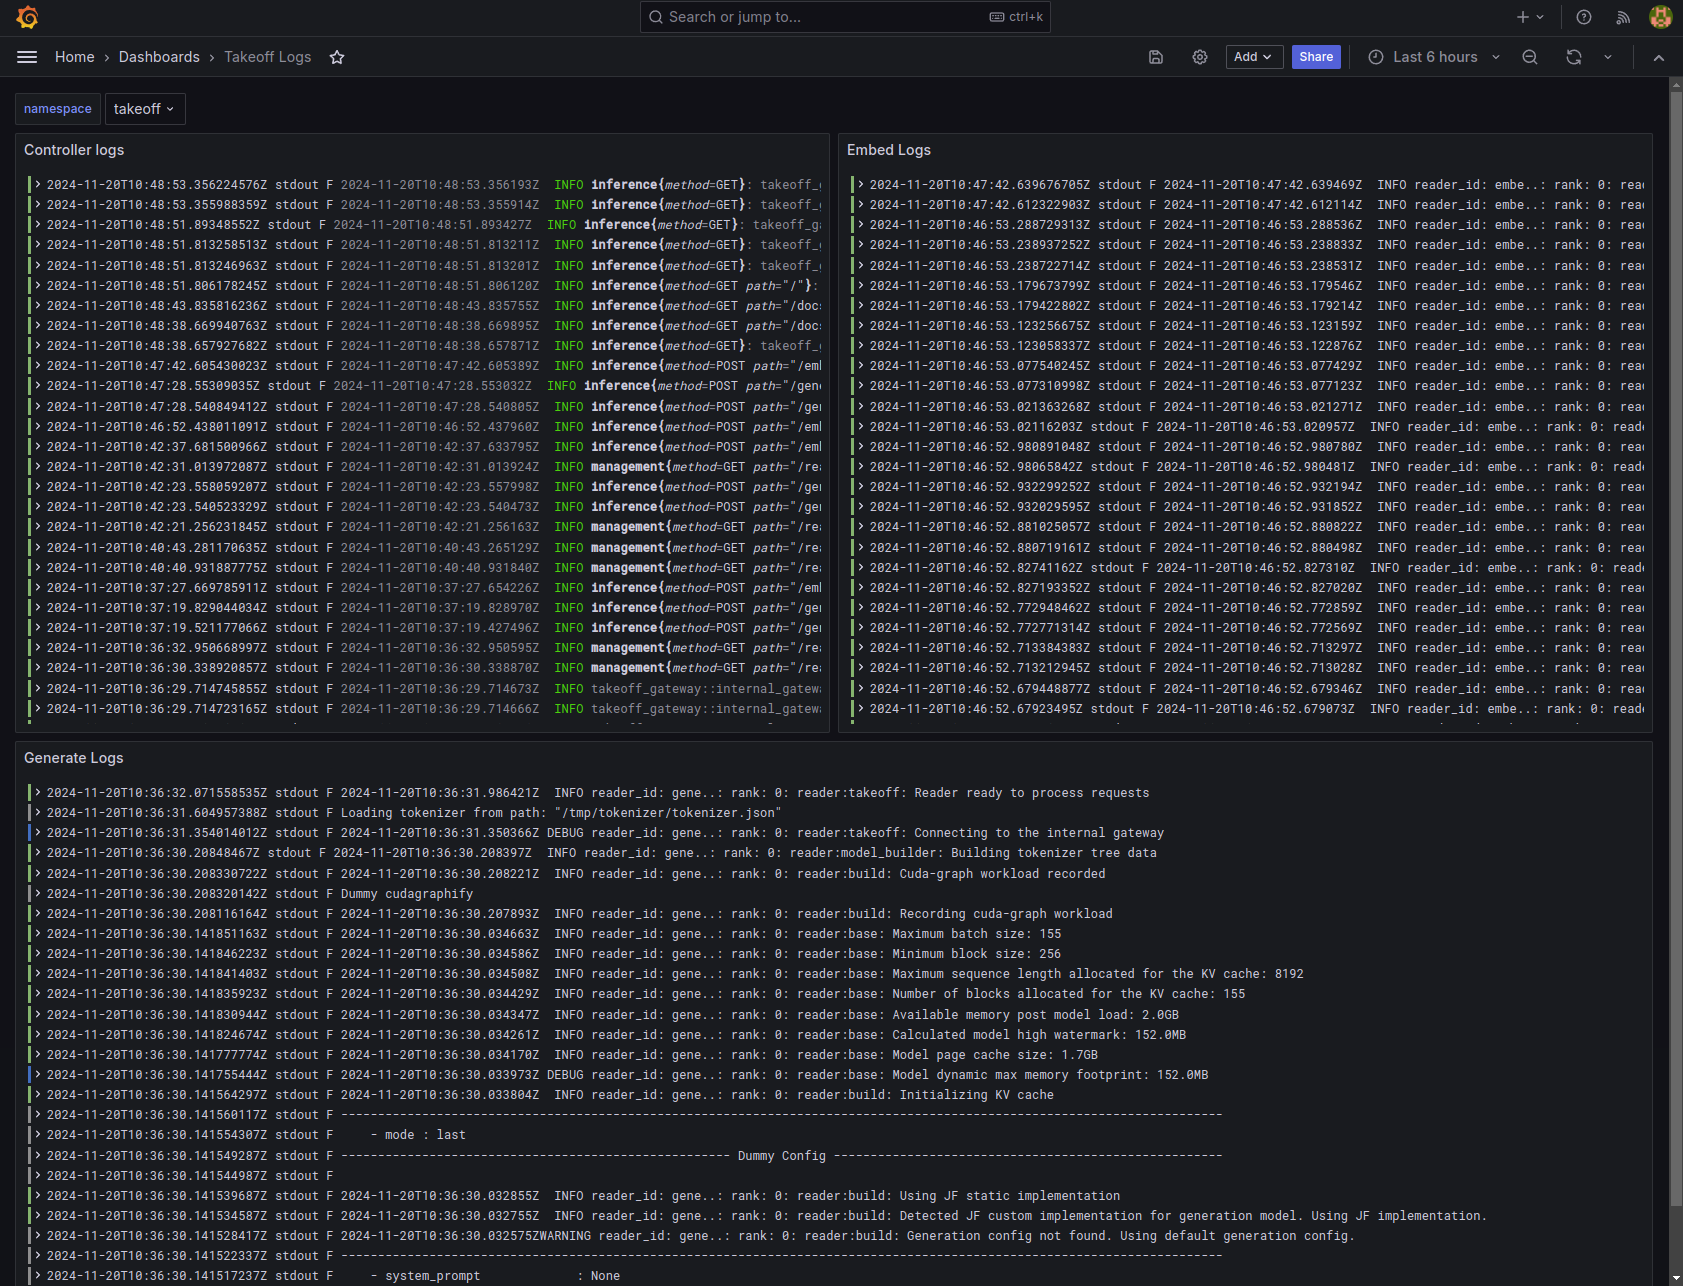
Logging is critical to help you quickly diagnose users problems but can be very tricky in a distributed system where a users' request may touch multiple components. We use Loki to collect logs from all the components of the stack. This allows us to easily search and filter logs to diagnose issues.
Example logs from the RAG server:

Example logs from the Takeoff server:
